Let’s get started!
or
You seem to have an account with this email already.
Sign in
Thank you! Your submission has been received!
Oops! Something went wrong while submitting the form.
Already have an account?
Sign in


If there is one quintessential task a startup CEO needs to be in charge of, it is not letting the company run out of money. Being on top of your Financial Model and business budget can make a huge difference and allow managers and founders to make game-changing decisions. For example, about nine months ago a quick prediction in our financial model enabled us to make our company profitable while duplicating our marketing budget. Our spreadsheet is an evolution of a financial model template created by our investors at Carao Ventures. Over the years, we've simplified it to remove unnecessary modules and adapted it to serve the purposes of our SaaS business model. We’ll elaborate on the main features we used to make the model work in our favor- it should work for most companies. You can get it here.
Financial modeling calculates the impact of an event on a company’s future. We typically use a spreadsheet for these calculations and sum up several variables in a model to forecast the future performance of a business. The idea is for these docs to allow startup decisions based on strong and quantitative reasons.
All financial models are spreadsheets, and our best suggestion is to go with Google Sheets, which will not only allow you to keep it in sync with other teammates but to automate certain tasks and data inputs based on your other spreadsheets in the cloud. A quick Google Search for 'Startup Financial Model Template' will reveal a few subscription tools that offer this service, but we encourage you to use a more 'universal' platform that will allow you to share it with anyone. All the formulas used in our model template were found with Google Searches and adapted to our needs.
Summary Spreadsheet: this is a custom page that you should build based on your most immediate needs. No formulas should be calculated here; this should just reflect important lines and results for your current company status: if you're running low on cash, this should be very focused on your bank statements. If you've just raised money using a great pitch deck, then this should be modified to look into your expansion budget. The Summary Spreadsheet also holds the Dashboard. A list of variables that you can comfortably adjust here, and measure their impact on the financials for the future.
FS-Month/FS-Annual: this is a standard Financial Statement sheet taking into account Income, Balance Sheet, and Cash Flow.
Revenue: this sheet should be adapted based on your Business Model. A SaaS product, for example, should have MRR and Churn as the core drivers/variables, while also accounting for estimated user cost of acquisition vs. monthly marketing budget.
SG&A: this is the main expenses sheet and the one you will want to update regularly based on your week-over-week spending.
COGS: there's a little debate over what should go here on an internet business. While COGS usually tracks the cost of production goods, we've started using it for services that are essential for our app to be live, including for example AWS and Intercom (one of the most important tools in our growth and customer success efforts).
WK+CAPEX: finally, this is where you manage physical assets and equipment. As a tech company, most of our CAPEX is on laptops and some office furniture, but we account for it nonetheless, along with its estimated depreciation.
We’ll begin by highlighting certain parts of the sheets to give you an idea of projections that you can eventually automate using our template. It's hard to fake such complex data, so some of the screenshots you’ll see here actually belong to our working model.
There's a very simple nomenclature:
Gray text: variables and manual inputs.
Blue text: formula results (avoid modifying).
Black text: historical/confirmed data.
Predictable Revenue is one of the reasons why I love SaaS businesses: once you have a good idea of your CAC and your Churn, you can pretty accurately estimate you much money you are going to be making in X amount of time or increasing your marketing budget by Y. These values are tracked in the Revenue Spreadsheet. In our model, we have a formula that takes into account the following variables:
Here's a sample of how that spreadsheet could look:

The idea on this spreadsheet is that you add actual data as you gather it. In this section, we have some historical data from 2015 that we've used as a starting example.
Note that most of this data is calculated automatically based on a few inputs (blue font = formulas/automatic data; gray font = variables/manual inputs).
In our particular case, we use ChartMogul to track our SaaS metrics, so we make a CSV export every month to make sure we update this data with the actual numbers.
Once you have a basic data set like this, you can use these formulas to predict your upcoming months:
Now, you'll want to play with different scenarios regarding Marketing Budget, Cost of Acquisition, and expected Churn Rate.
CAC Trend is a variable we like to use to account for increases/decreases in our Acquisition Costs. For example, if you increase your marketing budget by 3x from one month to the next, you can't expect similar CAC results.
This is where CAC Trend comes in handy. If you are becoming more efficient in acquiring customers (like we did when we invested in SEO), your CAC will go down. If on the other hand, you rely heavily on paid acquisition, your CAC will inevitably increase as you spend more, and you'll want to account for that in your model. This is how a few months of predicted data will look, based on the variables above

When we joined the Profitable Startups club, we did it by hacking the MRR to Revenue value on this spreadsheet.
The monthly revenue of a SaaS business is usually a little higher than the MRR, because of pre-paid, yearly subscriptions. In our case, our Net Revenue was usually around 1.05x to 1.1x MRR, but by motivating users to subscribe to yearly plans, we were able to increase it to 1.3x. This meant that an MRR of $20,000 would result in around $26,000 of monthly revenue.
The Payroll section of your SG&A Sheet is divided into two parts. Above, you have the actual cost of your employees, and below you have the number of employees for each task (Headcount). Some of them, like the CEO, are unique, and the number will hardly ever go above 1, but for some others, like Graphic Designers or Customer Success Representatives, you may have more than one team member of the same type.


You can manually enter numbers in the Headcount section when you predict you'll be making new hires to the team, but you can also come up with a formula to take care of that, especially for hires that you need to scale as your customer base grows, for example.
Let's take the Customer Success team for example. As a presentation software company, we predict that for every 1,000 paid customers we need to have a new, extra Customer Representative. You can implement this formula to your Customer Success team line:
(Customers/1,000)
This result will give you a decimal number. Also, it is expected that you will start with one person regardless of how many customers you have so you can change the formula to this:
ROUND((Customers-1000)/1000,0)
Guess what? The number of Customers in your Revenue sheet is affected directly by our Marketing Budget/CAC formula. That means that if you predict 10,000 clients in the next 12 months, you will have a decent estimate of your staff costs. With the variables we used above, you'll be expected to hire a new Support Team member by Month 10.
This formula may also be evolved by:
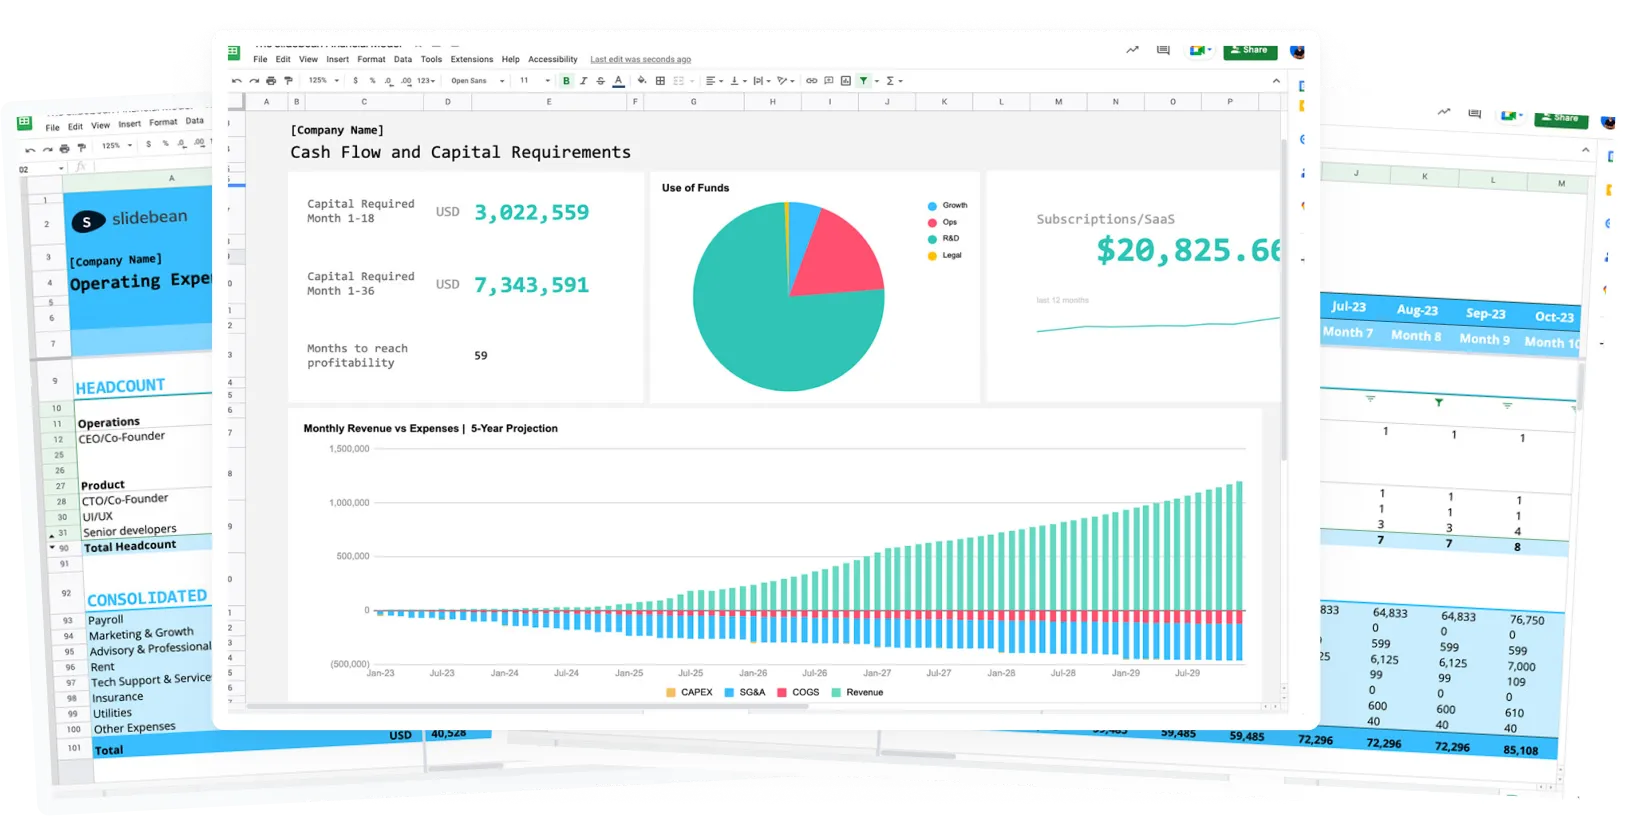
This model has a smart addition to the Financial Statement Sheet; a 'Capital Requirements' and a 'Runway' line.

Runway takes into account an average of your burn rate for the last three months and estimates how much longer can your company survive with those expenses. If you are profitable, this will change to infinity.
The Capital Requirements line gives you a rough prediction of how much money you need to raise for your Business Model to work. Most companies will need to make an up-front investment either in their team, their technology, or their supplies before turning a profit. If you complete your model correctly and with the right estimates, capital requirements will give you the lowest negative balance your company will reach, which you can 'fund' with a capital injection.