What is Financial Modeling? Examples & Templates

Having a startup is a fascinating experience. Every day comes with new challenges, as you put your ideas and yourself to the test. From talking to possible investors to fine tuning your product, your to-do list can seem endless, and there's one thing that should be on top of it. Building a financial model is essential for a startup, and sometimes, founders forget to do one.
A startup financial model is one of the first elements that will provide the foundation for the future of your startup. This article will explain why it's essential and how to build one. So, if you haven't made your own, it's time to start and, if you have, it's always great to have a refresher.
What is Financial Modeling?
Financial modeling is the process of creating a detailed representation of a situation using math and predictions. People use financial models to make informed decisions about investments, budgets, and plans. To make a financial model, you compile data and assumptions into a model. This model can be used to evaluate different financial strategies. It includes projections for income, expenses, cash flows, and other important variables. Financial modeling is an important tool for understanding the potential outcomes of different financial decisions.
What is a financial model?
If you don't have a financial model, it's okay! The first and most important aspect is that it's not complicated to grasp its basics. Next, financial modeling considers your company's past, present, and future operations. From there, you can start adding information that will help you make the right decisions at the right time.
Financial modeling summarizes your startup's expenses and earnings, usually in a spreadsheet, that you can use to calculate how a decision will impact your company. Not only that, it helps anticipate if and when your company can run into financial hardship.
Having a financial model is helpful because it provides you with a tool for understanding why your projections and results differ. Plus, one of the most valuable benefits that a financial model can provide is that it illustrates your startup's potential to investors. So, before we explain why it's so valuable, we'll detail why founders should care about building a financial model in the following section.
Free Financial Model Template
Why should founders care about building one?
A startup needs money, and that's no secret. Plus, understanding how your company is operating is crucial for its long-term success. So, founders should build a financial model because it provides a tool to help you manage these two critical aspects.
Raising money from investors is essential for founders. After all, it's what keeps startups alive. Plus, you can't plan your next move without knowing how much money you will have. That's why sitting down with investors is crucial, and you have to establish a game plan beforehand. As we'll see later in this article, most investors want you to have a realistic 3- to 5- year forecast, for which the financial model is vital.

There is, however, a word of warning. Many startup founders focus too much on this stage, to a fault. Now, this doesn't mean that you have to ignore the financial model, but it's all too frequent that founders obsess over having a perfect model instead of understanding it.
Since a financial model speaks of your company's current processes, past learnings, and future estimates, it's more important to know the vital components and how they work instead of having a perfect 5-year financial projection.
Another aspect of importance that founders should consider is that a financial model isn't only for raising money from investors. It's also a vital tool for managing your business right now. Testing ideas through a model allows you to decide before you dive headfirst into a significant monetary commitment.
Other benefits to an excellent financial model include monitoring cash and financial planning. Yes, you will be reaching out to investors, but you also need to control the resources you have right now. It can help define how you approach investors and how much money you need. As you can see, having a financial model is critical, and so is knowing how to build one, which we'll discuss in the following section.
Slidebean Team can help you build your startup financial model
How do you build a financial model?
We've seen the value that a financial model will add to your startup, and, most likely, you're itching to get going. So, how do you start? What are the first steps to take? You might feel overwhelmed when answering these questions, so this section explains the key components and how they connect.
Your startup's historical results are the first components you need to build your financial model. Therefore, it's ideal to start with three years of financial statements. This information should be sufficient to let you calculate revenue growth rate, gross margins, fixed costs, Accounts Payable (AP) days, and inventory days of said period.
Since investors want to see projections for the future, it's best to generate assumptions for the past three years so that you understand how your predictions behaved compared to your actual performance.
With the assumptions ready, you can calculate the income statement. This calculation includes factors such as COGS (Cost of Goods Sold), gross profit, and operating expenses, including EBITDA (Earnings Before Interest, Taxes, Depreciation, and Amortization). For this, you will have to calculate each of the factors.
These two components are essential in creating the balance sheet. Inventory and accounts receivable are functions dependant on revenue and COGS, AR Days, Inventory Days, and accounts payable.
Capital assets like Property, Plant and Equipment (PP&E), debt, and interest require supporting schedules. These allow you to include capital expenditures, depreciation, add increases, and subtract repayments. You can now complete your income statement and balance sheet with this information. If you want, you can add information such as shareholder's equity.
The income statement and balance sheet will help you build the cash flow statement, which requires reconciliation. Keep in mind that this section describes the 3-statement model (income, cash flow, and balance sheet), and there are models you can use. We will enlist them in an upcoming section. Once you've completed the three statements, you can calculate the free cash flow and perform the business valuation.
With all these components, you can now create scenarios for analysis. In addition, you can incorporate sensitivity analysis to determine how much your company's value could change by changing assumptions. For example, these are valuable tools to calculate the risk associated with an investment.
Finally, it's essential that you understand all this valuable information that you've created. So, building graphs and charts help you have a visual perspective of your financial model. Plus, these will make the information easier for people outside your company, such as investors.
What are the Components of a Solid Financial Model?
The following summarizes the essential components that a solid financial model should have. From top to bottom, these are:
- Assumptions and drivers
- Income statement
- Balance sheet
- Cash flow statement
- Supporting schedules
- Valuation
- Sensitivity analysis
- Charts and graphs
Why Investors Care about your Financial Model?
We've covered why a financial model is vital for you as a startup founder throughout this article. We've also discussed the key components and how to build one. Finally, we will explain why investors care about your financial model in detail.
Financial modeling is critical for decision-making within your startup, and that's one of the most vital factors for investors. However, here's when inexperienced founders make a common mistake. A financial model isn't only to show projections that seem perfect; it also helps investors understand that you have a pulse on your company.
It's easy to rely heavily on projections to justify that the financial model is perfect; therefore, you can attract investors. But, ask yourself: do you understand these projections? That's what investors look for, and that's why financial models are essential for them.
Experienced investors already know that your projections will not come to fruition 90% of the time. There are so many variables that can come into play when running a startup that it's more about dealing with surprises, rising challenges, and everyday operation than hitting a projection.
Don't obsess with the projections. Instead, it's more important to understand how they come about, the critical components to creating them, and, more to the point, how each one works.

Investors want to see a robust revenue growth model, and that you can answer the question: how will your startup make money? You also have to show that you understand the Key Performance Indicators (KPIs) to achieve that goal. These terms might seem basic right now, but if you can't answer the question with ease, then you should focus on that.
The next point is one of the most crucial for a startup founder to understand. At the same time, it's often ignored or miscalculated. You need to identify your expenses and calculate them precisely. Unfortunately, it's prevalent that founders undercalculate them and end up burning through money at a faster rate than expected. So, investors will quiz you on this.
Once you explain to them how you plan to make money and how much your startup will cost to operate, it's time for you to show them that you will efficiently use the money. After all, they don't want to invest and have that money disappear in no time.
Experienced investors want you to understand your business. However, they know that to accomplish this, you have already gone through learning the variables that impact your company. The financial model is only the result of that exercise.
As you can see, a financial model is a vital piece of your startup. It also speaks volumes of the work you've put into knowing your business and why investors care about financial models. Speaking of which, we covered the 3-statement model previously, and, as we said, it's not the only one. In the next section, we explain the more common types of financial models.
What are the different financial models?
There are many types of financial models that you can use to suit your startup's needs better. Each will provide strong points that you exploit to your advantage while having weaknesses that you need to consider before using.
It's also important to highlight that not all models work the same way for startups at different stages. In this section, we're listing the ten most common types of financial models, as well as providing a quick explanation of each. Let's start with a list:
- Three-Statement Model
- Discounted Cash Flow Model (DCF)
- Merger Model (Sometimes referred to as Merger and Acquisition Model, M&A)
- Initial Public Offering Model (IPO Model)
- Leveraged Buyout Model (LBO Model)
- Some of the Parts Model
- Consolidation Model
- Budget Model
- Forecasting Model
- Option Pricing Model
1- Three-Statement Model
This model is the basic setup for financial models. It allows you to create assumptions that can show changes in the model. One of the challenges in this model is that it requires advanced knowledge in spreadsheets, finance, and accounting.
2- Discounted Cash Flow Model
If you want to build off the Three-Statement Model, you can use the DCF to value your company by using the Net Present Value of the company's future cash flow. The DCF model is standard in capital markets, especially in equity research.
3- Merger Model
The Merger Model is most common in investment banking and corporate development. It evaluates the accretion or dilution of a merger or acquisition. It's a more advanced tool that can vary in complexity to adjust to several scenarios.
4- Initial Public Offering Model
As its name implies, this model is ideal for when a business goes public. The variables allow this model to calculate how much investors would be willing for the company in question by comparing it to other companies.
5- Leveraged Buyout Model
The Leveraged Buyout Model is an advanced form of modeling. It's one of the more complex and challenging types, as it requires creating multiple layers, cash flow waterfalls, and debt schedules. You can most frequently encounter these in private equity and investment banking.
6- Sum of the Parts Model
If you combine several DCF models and add components that might not suit DCF, you get the Sum of The Parts Model. It allows you to understand how parts of different business units affect the company's net value.
7- Consolidation Model
The Consolidation Model adds multiple business units to a single model. It's similar to the Sum of the Parts and works best for consolidating several business units.
8- Budget Model
Professionals in financial planning and analysis use this model frequently to create a budget for the coming years. You can make these using monthly or quarterly figures.
9- Forecasting Model
As a complement to the budget model, the Forecasting Model allows financial planners to compare the forecast with the budget.
10- Option Pricing Models
Option Pricing Models rely on mathematical formulas, so they are ideal for direct calculations of either binomial tree or Black Scholes pricing models.
These are the ten most common financial models that you can find. As a founder, you can explore these and test out which one is best.
Who builds financial models?
We've seen that creating a financial model is essential for startup founders and entrepreneurs. Nevertheless, it's not an easy task that you can tackle immediately. While it's critical for attracting investors, it's also essential to do it right. Time is of the essence for startup founders. So, not everyone can sit down and create a financial model, test it out and present it to investors. At the same time, some might be proficient in Excel while others might not consider it their strong point.
Slidebean has a team of financial modeling experts that you talk to

The market offers many platforms out there that can create financial models for you to solve this situation. Regardless of which one you choose, it's vital to understand how a model comes to life, what variables it uses, and where they originate. Remember that a financial model is essential for your startup because it shows how much you know about it.
Join our Workshops
7 financial modeling examples and templates
Startups are always searching for the right financial model. What's the right way to grow your business? How do you know when you're ready to scale? These seven options will give you a variety of models to choose from, each with its own advantages and disadvantages. Use them as a starting point, and find the one that fits your company best. Keep in mind, though, that no model is perfect - it's important to adapt as your business grows. So be prepared to change things up along the way!
1- eCommerce Financial Model template
If you're starting an eCommerce business, it's important to have a financial model in place. This will help you track your expenses and profit margins, and make sure your business is sustainable, and also will give you an idea of some of the key inputs and assumptions that need to be made when building a financial model for your eCommerce startup.

DOWNLOAD THIS eCOMMERCE TEMPLATE
2- Subscription Business Financial Model
When starting a subscription-based business, it's important to have a financial model in place to help you make decisions about pricing, customer acquisition costs, and more. This template will help you create a financial model for your subscription business.

DOWNLOAD THIS SUBSCRIPTION TEMPLATE
3- Marketplace Financial Model
What is the best way to structure your business finances? What is the best payment model for your company? How can you make the most profit? These are all important questions to consider when running a business. This model is designed to help you forecast and understand the key drivers of your business. It's easy to use and customizable, so you can adapt it to fit your specific needs.

DOWNLOAD THIS MARKETPLACE TEMPLATE
4- Mobile App Financial Model
When creating a mobile app, it is important to have a financial model in place to ensure that the app makes money. How much should you budget, and how should you think about making money off of your app? So, whether you're just starting out or you're already in the process of creating a mobile app, this financial model should work for you.

DOWNLOAD THIS MOBILE APP TEMPLATE
5- Hardware + Subscription Financial Model
When it comes to the subscription financial model, there are a lot of misconceptions out there. Some people seem to think that it's only applicable to software companies, while others think that you need a ton of users or customers in order to make it work. Our financial model considers all of those elements to help you make accurate estimations.

DOWNLOAD THIS HARDWARE TEMPLATE
6- Social Media Platform Financial Model
As a business, you may be looking for new and innovative ways to reach your target market. Social media platforms are a great way to do this, and can be very profitable if done correctly. But before you dive in, you need to create a financial model for your social media platform. This will help you determine whether or not the venture is feasible and how much money you can expect to make. So, how do you go about creating a financial model for a social media platform? Let's take a look.
Creating a financial model for a social media platform with this template is actually quite simple. You'll need to estimate your monthly costs (including bandwidth and hosting fees) as well as your projected monthly revenue.

DOWNLOAD THIS SOCIAL MEDIA TEMPLATE
7- Blog/News Site Financial Model Template
Whether you're starting a news site from scratch or looking to improve an existing one, having a financial model in place is key. This template will help you track your expenses and revenue so you can keep your site sustainable and profitable. Download it for now!

DOWNLOAD THIS BLOG TEMPLATE
Having a reliable financial model is essential for any business. Not only will it help you make better decisions, but the future of your company may depend on it. The benefits of having one are many, most notably they help you predict the success or failure of your company and make more strategic decisions with confidence.
Slidebean Agency team can solve this for you. We help founders build their Financial Models. Our Custom Startup Financial Model is a summary of your company’s revenue and expenses. Using historical data, a model allows the business to track KPIs such as gross and net margin, as well as forecasting future performance, based on critical metrics like customer cost of acquisition.
How else can we help?
Financial Modeling Sprints
We know what it takes to run your startup's finances.
That is why we've developed a program that teaches founders the logic behind driver-based financial modeling while our team helps them build the spreadsheet they'll need in order for their business plan and budgeting process be as efficient, effective, yet easy on you, the entrepreneur, as possible so there are no hidden surprises when revenue doesn't meet expectations or costs exceed estimates because this all can easily be predicted beforehand.
Join our Financial modeling workshop and get the answers you're looking for about your business.
Join the Financial Model Sprints
Related video
.webp)

Let’s move your company to the next stage 🚀
AI pitch deck software
Free sign upPitch deck services
Start a project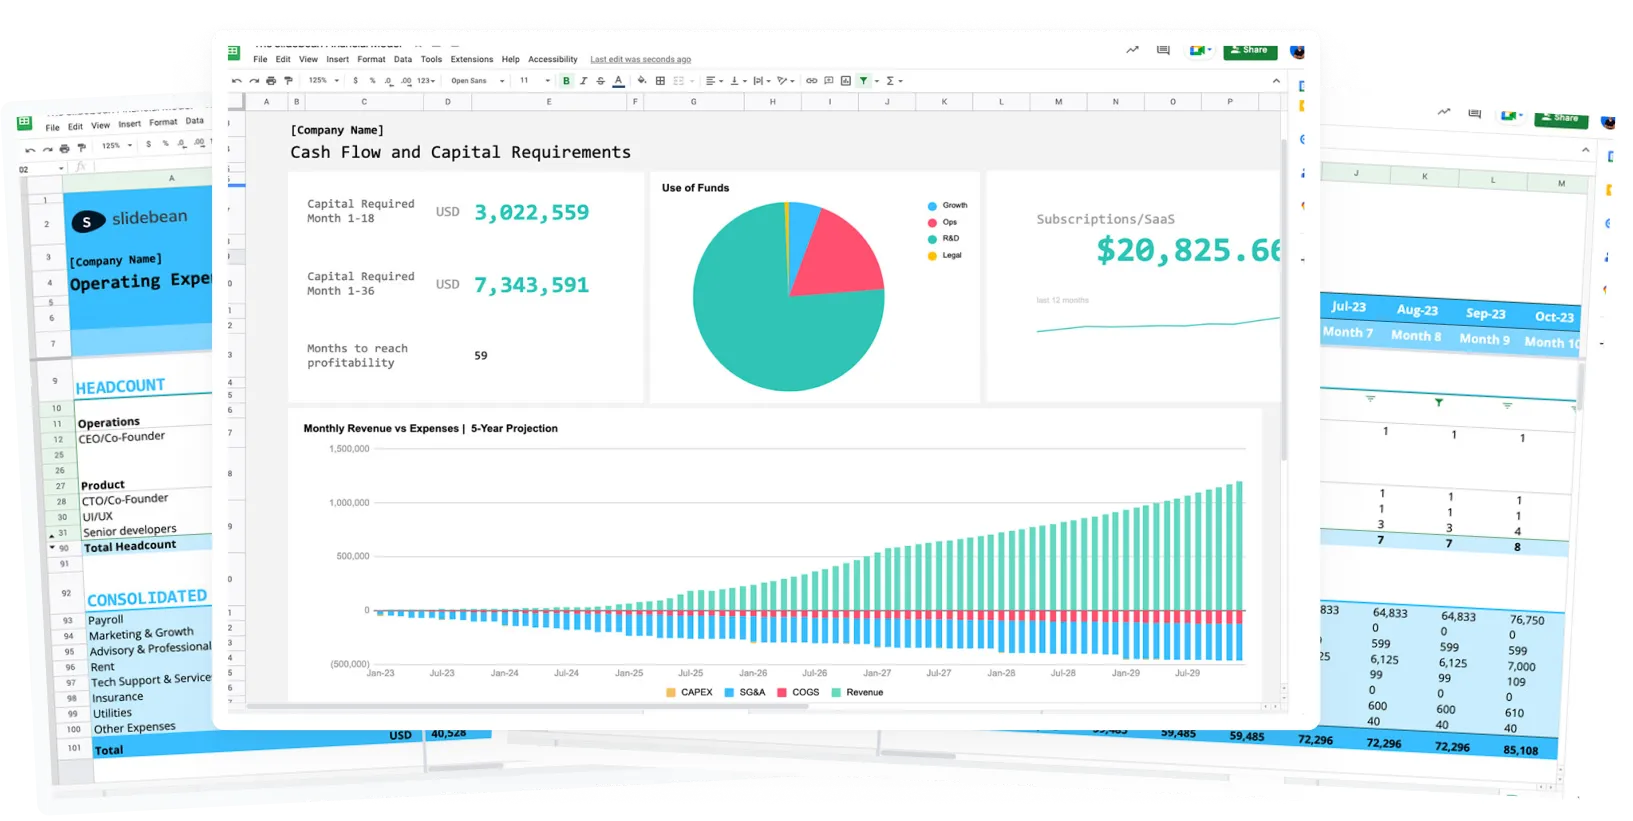
Financial Model Consulting for Startups 🚀
We can help craft the perfect pitch deck 🚀