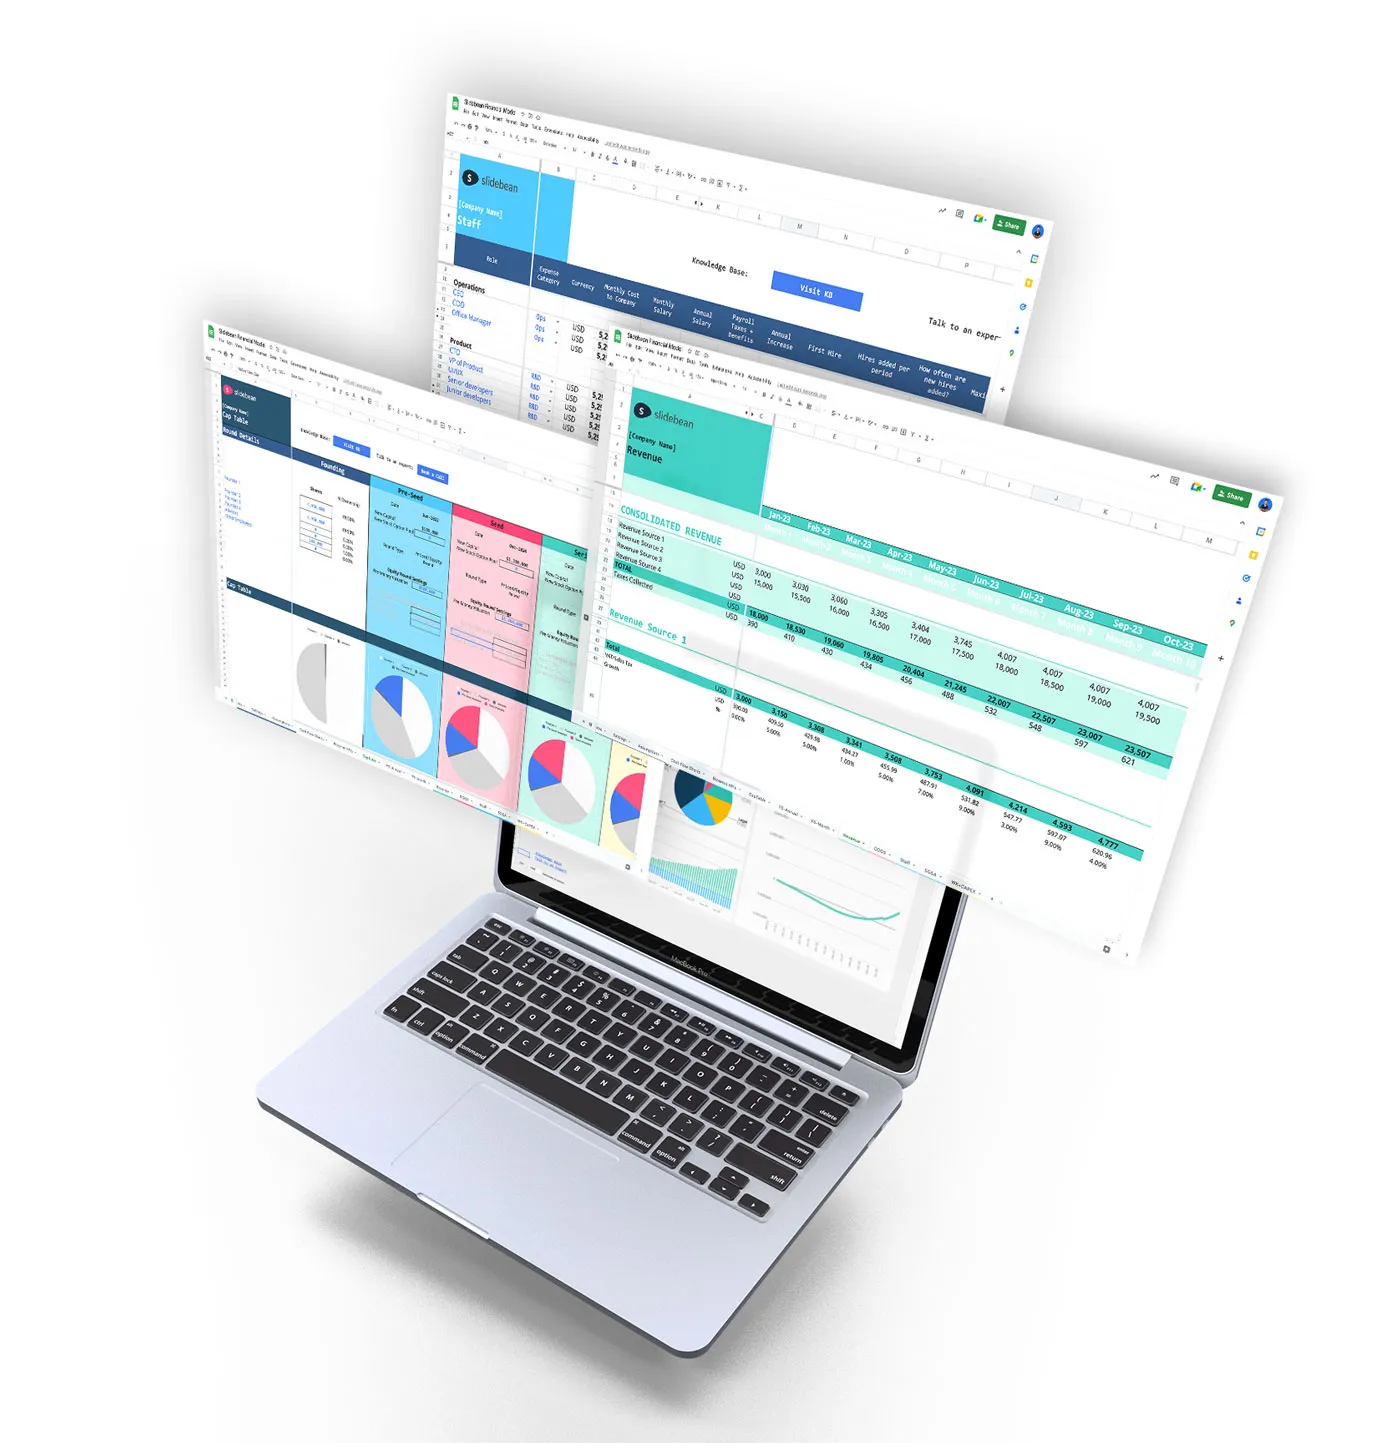
Financial modeling has become a recurrent topic that has generated interesting questions and discussions with founders. That's why we've not only created a lot of content around it, but I built a template myself -based on an old Excel sheet I got from one of our investors- which you can download for free.
A bunch of the startups we work with at Slidebean were struggling to figure this out, and hopefully this template and tutorials are useful to you as well.
I've created some other versions available for purchase, which are already formulated for you to fill-in-the-blanks.
Download your financial model
What is a financial model?
A financial model is an essential tool for every business owner that’s built in Excel or any other spreadsheet processor to calculate their business’ financial performance into the future. The calculation is typically based on the company’s historical performance, or assumptions about the future. How to build a financial model is usually answered into its sections SG&A (Selling, General, and Administrative Expenses), COGS (Cost of Goods Sold), Revenue, and CAPEX (Capital Expenditure).
If you're starting a business, a Financial Model is a critical tool to estimate the potential of your company.
In a nutshell, what an effective model should do is:
- Take an estimated ad/growth/marketing/sales spend.
- Estimate the revenue generated from it.
- Estimate the costs associated with generating that revenue, including team, office, server, etc..
- And finally, give you an answer on whether this combination of variables in making the company grow.
For early-stage startups, the model should take in the team size, the team expansion, and compare it to the available cash, perhaps from a round of funding, do understand what the exact company runway is.
If you've done your model right, you should be able to scale your team and your budget, understand the revenue impact of those changes and measuring how much that will affect your runway.
Financial Modeling Workshop
The basic parts of a financial model
COGS Sheet
That stands for Costs of Good Sold and relates to the direct costs associated with providing your service.
For a supermarket or an eCommerce store, COGS is straightforward. It's the cost of the groceries or the items sold that the company pays to the suppliers.
Most software companies use COGS for server costs and other essential tools that the platform needs to be functional. In our case, tools like Intercom and Amazon Web Services are part of COGS.
If your compare revenue to COGS, what you get is the Gross Margin: the margin your company makes before accounting for the administrative expenses.
Revenue Sheet
Revenue is used to track and estimate, well, your revenue.
What is absolutely vital for any model is what drives your revenue. Revenue doesn't just 'come.' You have to bring it in. Depending on your business, you'll need to pay to market your app or pay to get leads. You might even need to pay for a sales team to close those sales.
If, for example, your model estimates a $10,000/mo marketing budget that doesn't increase, it makes no sense that your revenue grows to $10MM in year 3. That's just impossible.
There needs to be some correlation with reality here, and many of these benchmarks are available out there.
SG&A sheet
Pretty much every expense that does not classify as COGS goes into the SG&A sheet. That includes payroll, marketing costs, travel, office expenses, rent, accounting, consultants... you name it.
Working capital and CAPEX
This sheet is meant for assets owned by the company. If the company buys a car, that car is not an expense; it's an asset.
The car affects your cash flow, yes, because you no longer have that cash available in the bank, but the asset should be logged in the model. The number of assets a company has an impact on its valuation, or, for example, if the company goes bankrupt and needs to liquidate them.
Desks, computers, and other matches are often assets and not expenses, and these are to be logged on this sheet.
Team and Salaries Sheet
This sheet lets you automatically estimate future hires without having to dig directly on the SG&A sheet.
You may, for example, define your dev team, how often do you expect to hire new team members, and how often do you plan to adjust their salary.
It's designed with employee categories in mind, so you shouldn't add each employee by name, instead, classify your team in each one of these buckets.
Make sure you use company cost for their salary, not actual salary paid out to them. In other words, include your payroll costs here, so that you don't have to deal with those on a separate line.
Projections Sheet
Now, this is where the magic happens. Programming all these formulas in is hard. You need some excel skills to do it, as well as time, and founders don't have a whole lot of that. On the link below, you can download a free version or purchase customized ones, which are automatically updated with formulas.
KPIs Sheet
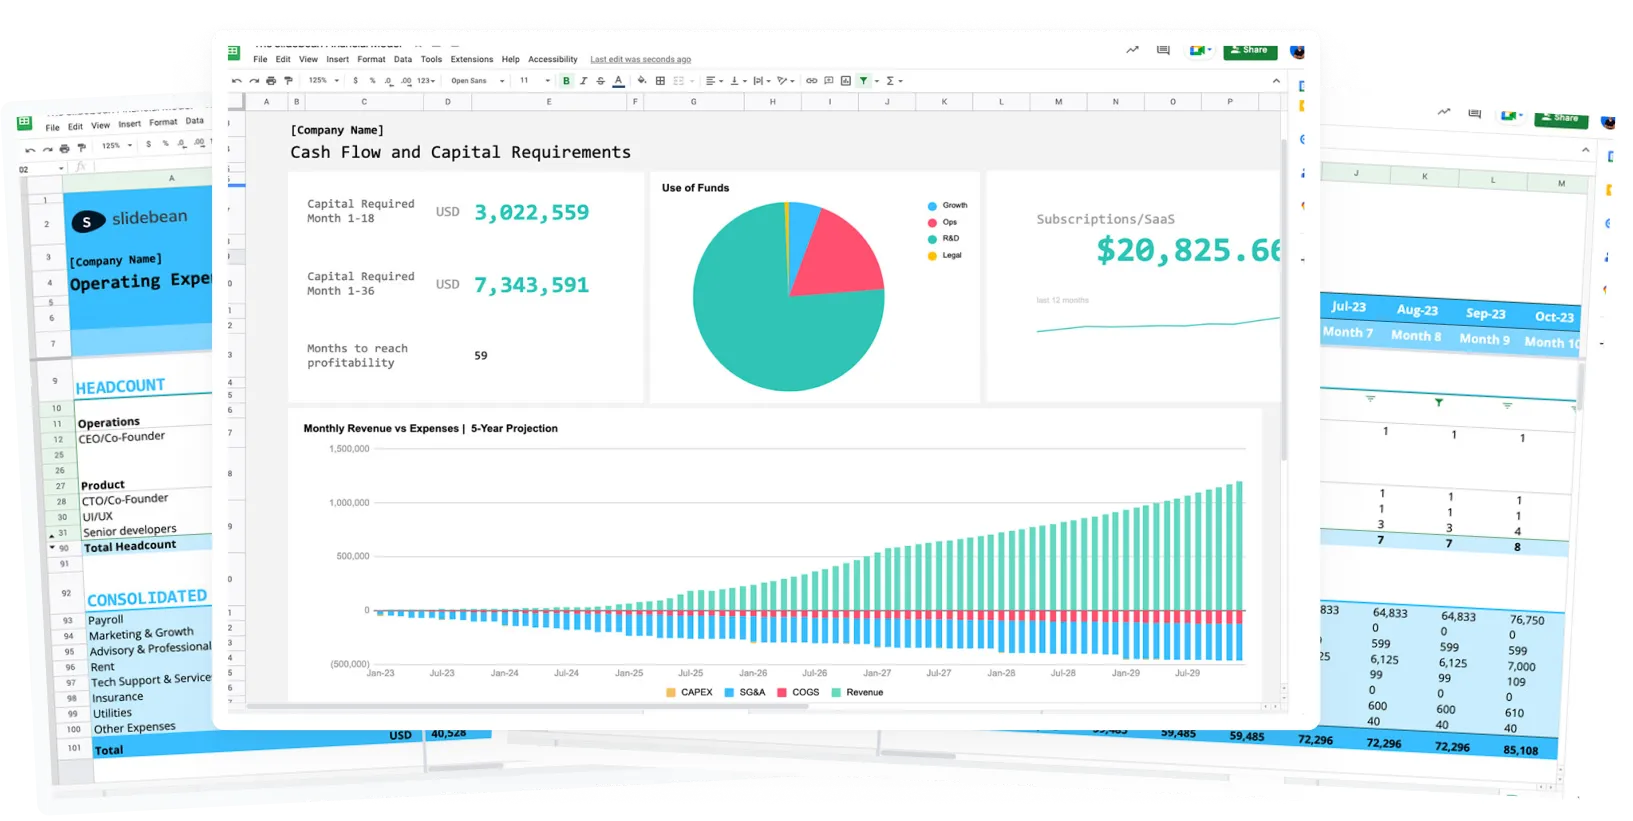
I've also added charts and a KPI sheet that lets you visually check the results of the model, as well as giving you some critical insights like an estimate of the capital you need to raise. Whether you can reach profitability in the projected five years, the model includes.
Startup Financial Model example - Slidebean (actual) earnings and expenses
We are going to review the full financials of Slidebean for our most important year: the year when we raised our first $250,000, the year when we grew our subscriptions by 800%. We'd like you to pay close attention to, how a Startup financial model looks, how a startup distributes its expenses, how much money is required to get a company off the ground, and a reality check, on the struggles you will have to endure as you start your first company.
Download your financial model
Financial Modeling 101: Tutorial and Template
It took us years to develop and understand a financial model that could take us to profitability. In this video, I break down our Startup Financial Model template step by step. Remember you can download it for free.
Download your financial model
Financial model for subscription businesses - Webinar recording
In this webinar recording I develop a step-by-step financial modeling tutorial, using a spreadsheet that can be easily downloadable and customized.
Download your financial model
How to estimate the revenue model of an eCommerce Business
I am going to show you how to estimate the business revenue model for an eCommerce platform with our financial model template. We’ll understand how a financial model works and we will go over all the sheets that you will need to complete. What is absolutely vital for any model is what drives your revenue, and this model will help you do all the math around it.
Download your financial model
Subscription / SaaS Financial Model Tutorial
This is another detailed step-by-step tutorial to use our SaaS/Subscription financial model. This time, recorded in-studio.
Download your financial model
Marketplace Financial Model Tutorial
Requested for a long time... here it is!
