When you live and breathe Software as a Service, terms like ARR, MRR, LTV, CAC become just part of your daily slang. Gross vs. Net MRR Churn, and how is it different from Customer Churn.
It's a real mess. So much so that for new company employees, I sometimes do a group class on 'understanding SaaS' to make sure they understand the language I speak after 6 years of running a SaaS company.
Software as a service key metrics
In this article, we'll go over,
- The basics, MRR and ARR.
- Expansion, contraction, and reactivation MRR.
- Churn Rate, and the difference between customer churn, gross revenue churn, and net revenue churn.
- Understanding negative churn rates.
- Estimating Lifetime Value.
- Cost of Acquisition, and LTV to CAC Ratio.
- Understanding Cohorts.
Let's start with the basics.
What is MRR and ARR
MRR stands for Monthly Recurring Revenue. That means the number of subscriptions that you bill each month: the number of people who are subscribed to your platform and who will be billed automatically unless they take action and cancel their accounts.
MRR is the reason SaaS companies are exciting to investors: predictable revenue. Subscription businesses can accurately predict how much revenue they are going to make in a given month.
If you multiply MRR x 12, you get ARR or annualized run rate. Same as before, this is a great metric to estimate how much revenue the company is able to generate yearly.

Assuming you don't add any customers, but you also don't lose any customers, the ARR paints a picture of the annual revenue the company can generate.
When a customer subscribes to an annual plan, say at $96/yr, the opposite happens. Since $96 is the annual revenue the customer will bring, the impact of $96 is reflected on the ARR. That means that to estimate the monthly impact of those $96, you have to divide them by 12. In other words, a $96 annual plan means $96 in ARR, but only $8 in MRR.
Now ARR would be beautiful if it was guaranteed, but there are always going to be cancellations. Luckily, there's a simple way to estimate how much time a customer will stay, based on historical customer behavior. That's why the churn metric is critical, and we'll spend some time talking about it.
Let's assume this platform called Slidebean, a super cool pitch deck builder powered by AI, subscribed 100 new users on a $29/mo plan in January.
That means the New MRR metric for January is $2,900. That's easy.
What is Customer Churn Rate
In February, this company adds another 100 users. That means they added $2,900 in MRR. However, they lost ten customers from the January cohort. A Cohort is a group of users who share characteristics, such as the month in which they subscribed, or the campaign that brought them in.
So just to keep track, this is how the MRR Movements table looks like. The company added $2,900 in MRR but lost $290 (10 customers). By the end of February, they have 190 customers and $5,510 in MRR.
How to calculate Churn
Alright, so let's estimate the churn rate. Out of 100 users, we lost 10. That means that our customer churn rate was 10%. The formula for this is,
- The number of users lost, divided by the number of users at the start of the period.

That means we have ten divided by 100. Remember, we are not counting the 100 users that we added in February. Those are new customers who weren't here at the beginning of the period.
Churn is an essential formula. If you divide one by a churn rate, in this case, one divided by 10% (or 1 divided by 0.1), you'll get the average lifetime for a customer (the number of months).

Customer Lifetime Value (LTV)
A churn rate of 10% means that the average customer will stick around for 10 months. If you actually break that down, you'll see that a cohort of 100 customers, where you lose 10% of them every month, means that by month 10, you'll have around 38 customers, by month 24, two years later, you'll still have about 9 customers. Even at month 45, you are still expected to have one customer. The average age of all of those customers is 10 months.
With a customer churn rate of 5%, the average lifetime would be about 20 months. A churn rate of 3% means an average lifetime of 33 months. And so on. The lower the churn rate, the longer the average lifetime.
Now, if you have the average number of months that a customer is staying, and you know, on average, how much that customer pays you... you have all the information you need to come up with a Lifetime value!
Customer Lifetime Formula
Using the Slidebean example again, let's say this fictitious but totally awesome company had a $29/mo plan and a $12/mo.
If the company had, say, $30,000 in MRR and 2,000 customers, you can divide the MRR by the number of customers and get a number called ARPU: average revenue per user.
$30,000 / 2,000 = $15

Some people also call that number ARPA, average revenue per account. This is mostly to distinguish that the ARPU/ARPA metric tracks your accounts, not your users. A company using Slack may have 50 or 1,000 employees. The SaaS metrics team mostly cares about the average revenue per company, not per each human using Slack.
So, if we know that, on average, an account is worth $25/mo for us, and with a churn rate of 5%, we know that the average time with us will be 20 months, we can multiply ARPU ($25) by months of lifetime ($20), to get $500. That is our customer lifetime value.
We can simplify the formula even more.

Great, so LTV = ARPU/Customer Churn Rate
The most basic business rule is that whatever you are paying to bring customers in needs to be less than the money you make from said customer.
The customer lifetime value is a great number to estimate that. If, based on your churn rate and your ARPU, you can estimate that a lifetime value for a customer is $1,000- you know that you can be aggressive and spend $400 to acquire that customer, because you know that, eventually, you will make that money back.
As a general rule of thumb, it's considered ideal that the cost of bringing a customer is one-third of the lifetime value. So, for the fictitious Slidebean with a $500 LTV, we should aim to spend about $160 to acquire a customer.
For the longest time, our CAC was much lower than that, actually, which was a sign we could afford to spend more aggressively on customer acquisition.
Revenue Churn rate
All of this time, I've been speaking about customer churn—the number of customers that we lost vs. the number of customers that we had.
But you can also measure churn from the revenue side. The amount of subscription revenue added, vs. the amount of subscription revenue lost.
In our most basic example (the one we used before), we lost 10 customers from January to February. 10% customer churn.
If we measure that by the amount of revenue lost, then the formula would be very similar:

In that case, since we lost $290, we divide that by $2,900 (the revenue we had at the beginning of the period), and we get 10%.
That is called our Gross Churn, and oftentimes, the number is quite similar to the Customer Churn number. So why do we measure it separately?
Well, because you can lose revenue without losing a customer. In our example, we had every single customer on a $29/mo plan, so each customer lost represents a revenue loss of $29.
However, if you have different plans, you might have people downgrading a plan. Let's look at the visual version.
Say in January fictitious Slidebean added 30 customers to its Starter plan, which is $12/mo, and they added 70 customers to their Premium plan, which is $29.

Great. Now just like before, by February, we lose 10 customers. Remember, while we might add new customers in February, those are not affecting our churn metrics since they are new customers. We are just comparing the customers that were already with us at the beginning of the period.
OK, so let's say we lost 5 customers from the Premium plan and 5 customers from the Starter plan.
The amount of Lost customers is 10. From a batch of 100 customers, that's s 10% customer churn.
However, the amount of Lost MRR is $205, because there's a mix of people from different plans. That translates into about 8.7% in gross revenue churn. Notice how it's different from the 10% customer churn rate.

Now, when you are dealing with multiple plans, you might also have people switching between plans. Following this same example, let's assume 5 customers from the Premium plan downgraded to the Starter plan.
So 7 people went from paying $29/mo to pay $12/mo. That's a contraction of $119.

That gives us a Gross MRR Churn of 13.6%
As you can see, in this particular scenario, our Customer Churn rate was a bit deceiving. Remember that customers that downgraded a plan are not counted as lost customers because they are still paying for a plan... it's just a much cheaper plan.
We think churn is 10%, but in reality, we are losing 13.6% of revenue every month. That's Gross Revenue Churn. And it's an ugly number, but there is some good news still. Customers might upgrade their plans!
While we have contraction revenue, we might also have expansion revenue from customers moving from the Starter plan to the Premium plan or adding new seats to their accounts (remember, we measure accounts, not individual seats).
We might also have reactivation revenue; those are customers that canceled and that came back to reactivate their subscription.
Technically that's not considered New MRR because they were our customers already, so it's classified separately as reactivation MRR.
The sum of all of those variables: reactivation, expansion, contraction, and lost customers give us a number called Net MRR Churn, or Net Revenue Churn, and at least for us at Slidebean, it's the most important number of all.
Let's look back at our 13.6% gross churn scenario. Let's assume that while we had cancellations and contractions, we also had some expansion MRR.
15 customers decided to upgrade their Starter plan to their Premium plan. Maybe they wanted to track investor views on their pitch decks. Perhaps they wanted access to our premium pitch deck templates. Who knows? They upgraded.
That translates into $255 in extra MRR from the same group of users that we had at the beginning of the period. Once again, these are not new customers; these are existing customers.
Also, let's say we saw 7 users come back from the dead. They reactivated their accounts, some on the Starter plan, some on Premium plan. They added $169 in subscriptions.
So, how do we estimate the new churn rate?
This is the churn formula.

So, the result here is -4.18%, and don't worry; this isn't your rusty high school math skills; the result here was actually -4.18%. What does that mean, negative churn?
Well, it's precisely that. It's SaaS Nirvana! Really. Negative churn is the number that gets SaaS companies funded.
Negative churn means that every month, your existing customers are growing. Every month, you make more money from the same batch (or cohort) of customers, on top of the new customers you are adding. Negative MRR churn is a beautiful thing to see and one that all SaaS CEOs fight for.
Great! The last part that we'll look at, is cohorts.
What is a COHORTS
For every single metric that we've talked about today, we are comparing the lost or earned customers on a period vs. the number of customers in the previous period.
If we ran these metrics for June, the formulas would be the same; we'd be comparing lost, contraction, expansion, and reactivation customers that occurred in June, regardless of when they signed up. This is great because it paints a clear picture of your average retention rate. That's the number you need to project your future revenue.
However, sometimes you want to look at a specific cohort of users: the users that converted on a given month and measure their behavior against users that came before. This is useful, for example, if you opened a new marketing channel on a given month or if you ran a promo. Discounts tend to bring low-quality customers.
You can also use cohort tables to measure your effectiveness when increasing onboarding or retention. And this is how they look:

If you look horizontally, you are looking at the cohort of users from a given month and how retention has been affected. If you look vertically, you are looking at the evolution: how many customers are you managing to retain by month 6, or by month 9, and how is that evolving over time.
You can run cohort tables based on your customer churn, your gross churn, or ideally, based on your net MRR churn. In here, you'll see Negative churn reflected as a retention rate higher than 100%.
Now, I have seen people try and run these metrics manually, but that is just silly if you ask me. It's a real mess to come up with these formulas and make sure that everything gets tracked correctly. Add a complication; if you are billing some of your customers via Stripe and some of them via Paypal, you have two data inputs that look drastically different. You want to consolidate this into a spreadsheet that actually makes your life easier.
Every single chart you saw in this video comes from ChartMogul, who also happened to sponsor today's video. ChartMogul is a Subscription Data Platform that plugs into your payment system like Stripe, PayPal, Chargbee, etc. and automatically generates all the subscription analytics you need to run your subscription business like a pro.
Still have questions?
Related video


Let’s move your company to the next stage 🚀
AI pitch deck software
Free sign upPitch deck services
Start a project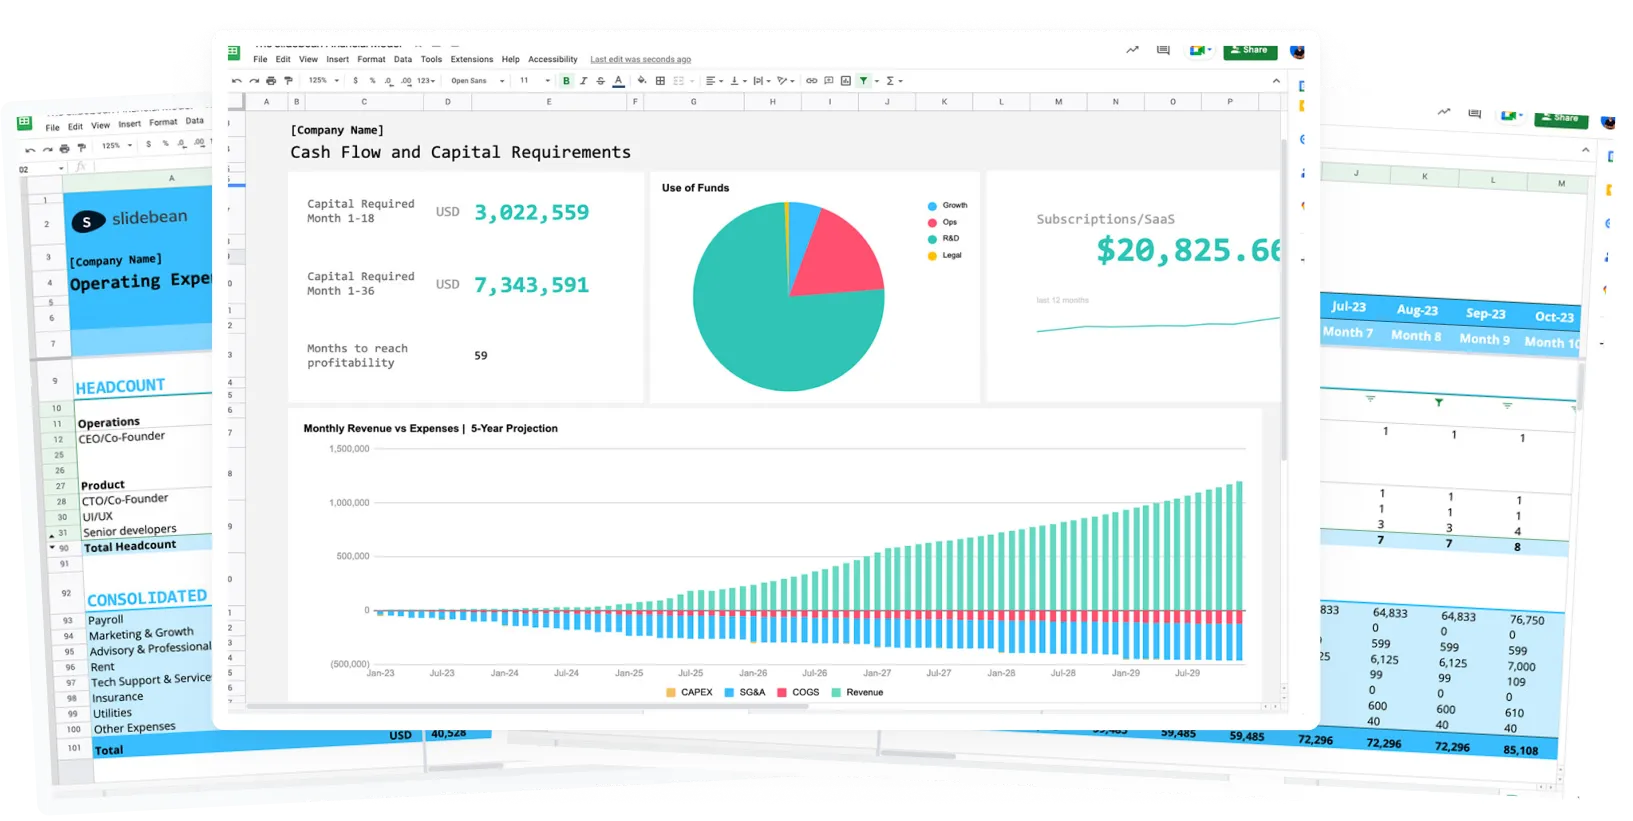
Financial Model Consulting for Startups 🚀

We can help craft the perfect pitch deck 🚀