Financial Modeling Explained: What is Driver-Based Planning?

I looked into every single video about Financial models on Youtube, and they all start with a spreadsheet.
And yes, of course, that’s what the Financial Model is, and we’ll get to spreadsheets today- but before that, we need to get on the same page about what the financial model is, how it should work, and the most common startup founders make when doing them.
A financial model is a sheet at which you through data: your expenses, your assumptions about the business, real benchmarks from other companies- and on the other side it should spit out some key company questions.
Some of them are urgent, almost life and death questions for your business:
- How much runway you have (how long until you run out of money).
- Can you afford that new hire? Or that new campaign?
- If you’re looking for investors- how much money do you need to raise, and when?

I’ve seen way too many founders put ‘we’re raising $1.5M on their pitch decks, and not have any numbers to back that up- or any idea where that gets them. And that, of course, falls apart really quickly when investors ask questions.
Other answers, more mid-term:
- How big can the company get?
- How much will getting that big cost?
- How effective will that campaign be?
- What is my company valuation?
Now the way many companies approach this is by putting out a few revenue assumptions or a few user assumptions.
This is how many users we’ll get every month, and therefore this is how much revenue we’ll make. Or even worse, they’ll say- we are going to grow revenue 10% every month this year. Period. And to do that here’s a marketing budget, and here’s who we hire.

The right way, is to understand what drivers your revenue, and to think of revenue as the Effect, not the Cause.

This is called Driver-Based modeling- and in this article, I’m going to teach you everything I know about it. We’ll draw diagrams for a few common financial models together- and we’ll get to turn that logic into an actual spreadsheet.
OK, like I said, we’re not getting into spreadsheets just yet. We work on dozens of these for our customers every year, and all of them start on a canvas.

Color coding here is Green for revenue, Red for Costs (any expense that is directly, proportionally tied to revenue, like servers or manufacturing costs).
Blue for SG&A (that’s sales, general, and administrative expenses- pretty much every other expense), and Yellow for CAPEX, or capital expenditures (which are your assets, like your computers- stuff that you own and still have monetary value).
This color coding is used on all our spreadsheet templates, so it’s easy to navigate and to tell what is what. I’ve placed links to all these templates here.
Each one of those categories is, of course, split into others, and most of them are pretty easy to grasp.
For example, you can budget your rent or add your subscriptions to estimate how much the bill will be at the end of the month.

Inside of SG&A, the easiest connection you can make is your Headcount to your tools.
For example, your GSuite will be $6/mo per user. So you know that for every new team member you add, you’ll pay Google an extra $6.
If you’re in a co-working space, that’s probably $500 per seat, so again, you can tie those numbers together always to have an accurate estimate of those expenses.
That’s the easy part. Let’s get to the good stuff.
Now if we were to draw out the model that I mentioned- the terribly wrong one- that’s a model in which Revenue is the input, so that is the driver. You input revenue, and that drives your hires and your marketing costs.

But that’s of course not how things work in real life.
In real life you spend money on a campaign, and that campaign will drive conversions.

Or you spend money on a sales team, and that sales team will drive new leads down your funnel.
Both that marketing campaign and that sales team are drivers. They drive the revenue. But most importantly, they are blue. You need to spend money so that if the campaign is effective, it’ll drive revenue.
This doesn’t make a whole lot of sense on a spreadsheet, and that’s why people get lost- but visually, it’s a lot easier to grasp.

And it’s these KPIs, the numbers in the arrows, that function as a reality check for your assumptions.
It’s common knowledge that a Cost Per Install will range between $1-$3 in the US; of that, a cost per click on Google Ads will rarely cost you under $1. That will help keep our assumptions within reality.
Let me show you a few common financial models
An app, for example, is driven by marketing costs that drive downloads. A % of downloads become active users, and a % of them pay whatever subscription or in-app purchase you sell.

A B2B platform, on the other hand, will probably spend marketing bucks to drive leads. Those leads will need to be processed by a sales team- maybe 100 leads per agent, per month- and some of them will convert.

Now that driver marketing budget may be a lot of things: sponsoring a booth at an event, or Google Ads, or influencer marketing. Your Head of Marketing will have performance numbers for each one of them, separately- and it can easily end up being dozens of campaigns; but what the financial model will care about is the macro trend, the general number: how much did we spend total, and how much did a lead cost.

You can make this more simple and more complex depending on how savvy you are.

In its simplest form, you go from the Paid marketing budget to new customers.
In a more complex example, you can account for website traffic, sign-ups, and monthly active users before conversions.
I want to pause for a second to clarify that the key here is not for the model to be perfect and to take every single trend into account. The key here is for the model to be useful for you.
I’m on our company Financial Model twice a week- budgeting and estimating. It needs to be easy to manage and respond to the needs of your business. It starts simple and gets more complex as the business evolves- as you understand the spreadsheet better.
OK, so what you can see here is that all of these revenue lines we talked about are driven by an expense.
When you are adding your own assumptions to the model, what you can control is how much you spend, and how well it works (with your conversion rates). That means that your assumptions are always grounded.
There is no such thing as a $0.01 cost per click. There is also no such thing as a 100% conversion rate. It’s also extremely unlikely that if you double your marketing budget monthly, that the same numbers will hold up. Aggressive spikes in spend usually lead to less efficiency.
Organic Traffic
Now there is one exception to this, one driver that is not directly tied to an expense: Organic Traffic.

Our business is built on Organic Traffic: about 1M views per month on our Youtube channel, 300K visits to our website. And that is not tied to an expense, at least not directly.
If I go and double our Media team next month, we won’t get double the number of views on Youtube. Same if I double our SEO team- because it doesn’t work like that- but it does work.
So to me, Organic Traffic is the only driver that is not tied proportionally to an expense. And I’ll allow it- as long as it is reasonable.
This may be a combination of referrals from existing customers (word of mouth), social media efforts, SEO, App Store optimization, branding efforts, PR…
All of those are important, useful, expensive, and slow- but impossible to tie to your expenses.
I would consider ourselves pretty good at SEO, and this is how long it took us to scale traffic to the site. Don’t assume yours will start at 100,000 visits.
There’s also a cap to it. We are close to that cap for a startup platform: because there aren’t that many people searching for what we do.
So when using Organic Traffic as a driver, keep those 3 rules in mind:
- Make sure you are budgeting the team that will cause that to happen (even if it’s not tied to it).
- Make it reasonable: maybe look at your competitor’s traffic.
- Know that the more traffic you get to a website, the lower the conversion rate will be. This is because SEO depends on content, and a lot of your traffic will be to blog posts, of people reading but not necessarily ready to convert.
If your website is mainly landing pages, those convert much, much better.
Revenue Lines
OK, we’ve covered drivers. Let’s zoom into those revenue lines now.
OK, so now that we’ve modeled the Cause of your growth, now we can look into the Effect.
eCommerce Platforms financial model
Let’s take the simplest case of an eCommerce platform.
A combination of Paid Traffic and Organic Traffic will drive new orders into your platform. In the simplest approach, you could take that expected number of orders per month, and multiply it by an average order size.

You don’t need to model and map every single SKU in your inventory. If you take the average order size and the average margin or markup that you are putting on products, that should give you a decent estimate of revenue.
Now that revenue must of course be tied to an expense, which is the products themselves, and the shipping per order.
SaaS Platforms financial model
SaaS is, of course, my favorite example. I see a lot of companies struggling to add plans to this- to break down how many people connect to each plan: but you don’t need that, at least at first.

You can just use ARPU (or average revenue per account). If you have a $50 and a $100 plan, chances are your ARPU will land somewhere in the middle- and you can use that to estimate your MRR.
And of course, don’t forget about churn. Customers don’t stay forever so you have to account for those monthly cancellations.
(We made a whole video explaining churn metrics, if you want a deeper dive).
The point is that the numbers your model uses, the inputs, and the drivers: are KPIs, KPIs that you don’t have to make up. You can ask other startups in your industry, and the very moment you have some user data yourself, you can plug these values in yourself.
In the case of SaaS, you could tie in your MRR, or your active customers to server and infrastructure costs. Those may be close to 0 today, but you need to know, what those will look like as you scale.
When you are doing driver-based modeling, you can also create other connections. For example, you can assume that for every 1,000 active customers on the platform you will need to hire a new customer support agent: which are themselves tied to that Google Workspace cost and that office cost we talked about.
At the end of the day, you have a model that does the homework for you- but nothing works unless you first understand this. We’ve done 100s of these to know that part is key.

OK, I want to spend some time on the spreadsheet now, showing you how this looks once we add it in.
But let me give you a real-life example now.
Financial Modeling Workshop
We have a new plan on Slidebean called the Financial Modeling Workshop, where we hand hold you in building a financial model for your business.
On Day 1 we’ll give you a blank model to start with, and then the plan includes two hours a month with a senior analyst to help you build this diagram and help you focus on what’s most urgent for your business- and it includes 6 hours of our Spreadsheets team to build any new functionality on the spreadsheet.
And since I’m training the newly expanded team, I’m going to be leading the next 25 projects we book: so I’ll play that Senior Analyst role, and you’ll get a couple of hours from me every month.
Most of the time, by month 1, we will have this diagram built for your business, and all of your expenses will be in the model- and by month 2, the first revenue lines have been built.
This is very much a teach a founder to fish approach, so we want you to take what you need, learn and then be on your way.
Book here if you’re ready to book a slot or get on a call with our sales team if you need more info.
And that’s how that model looks.
Our Financial Model Template
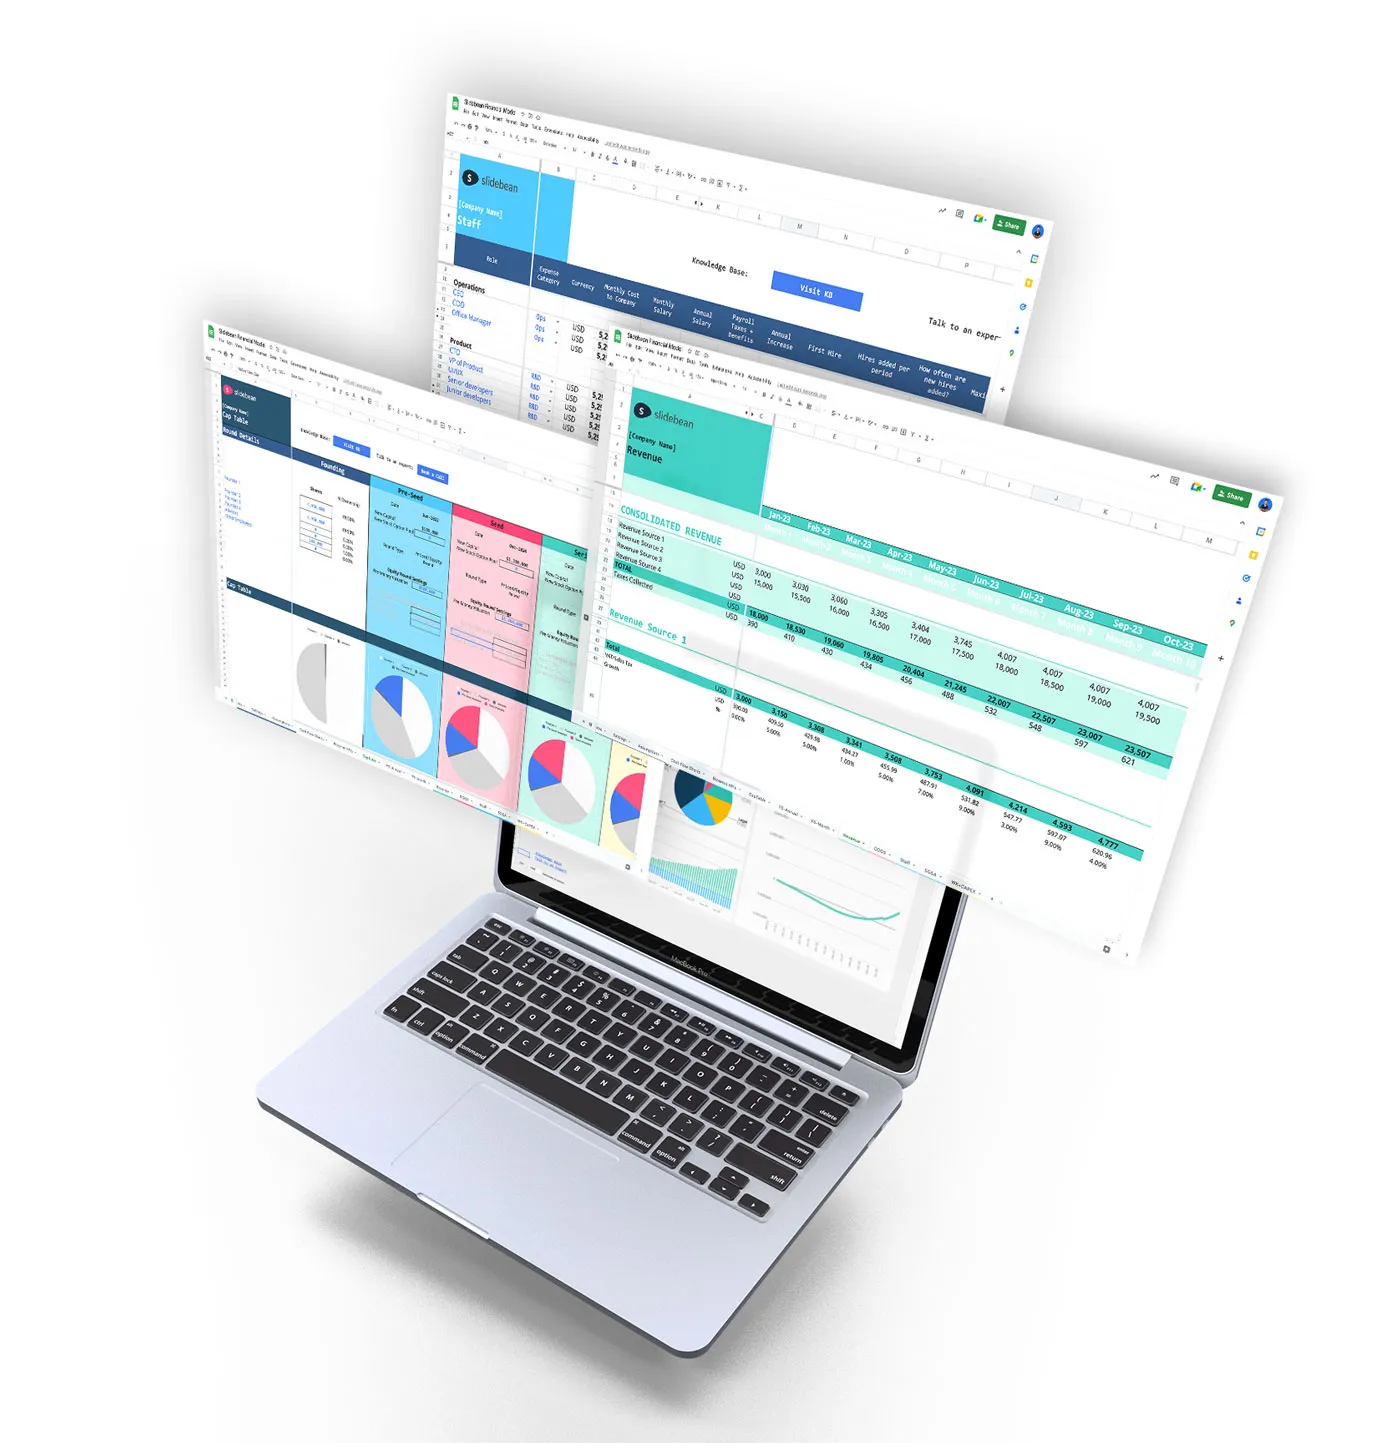
The spreadsheet, as I said, is a blank financial model that’s available as a free download.
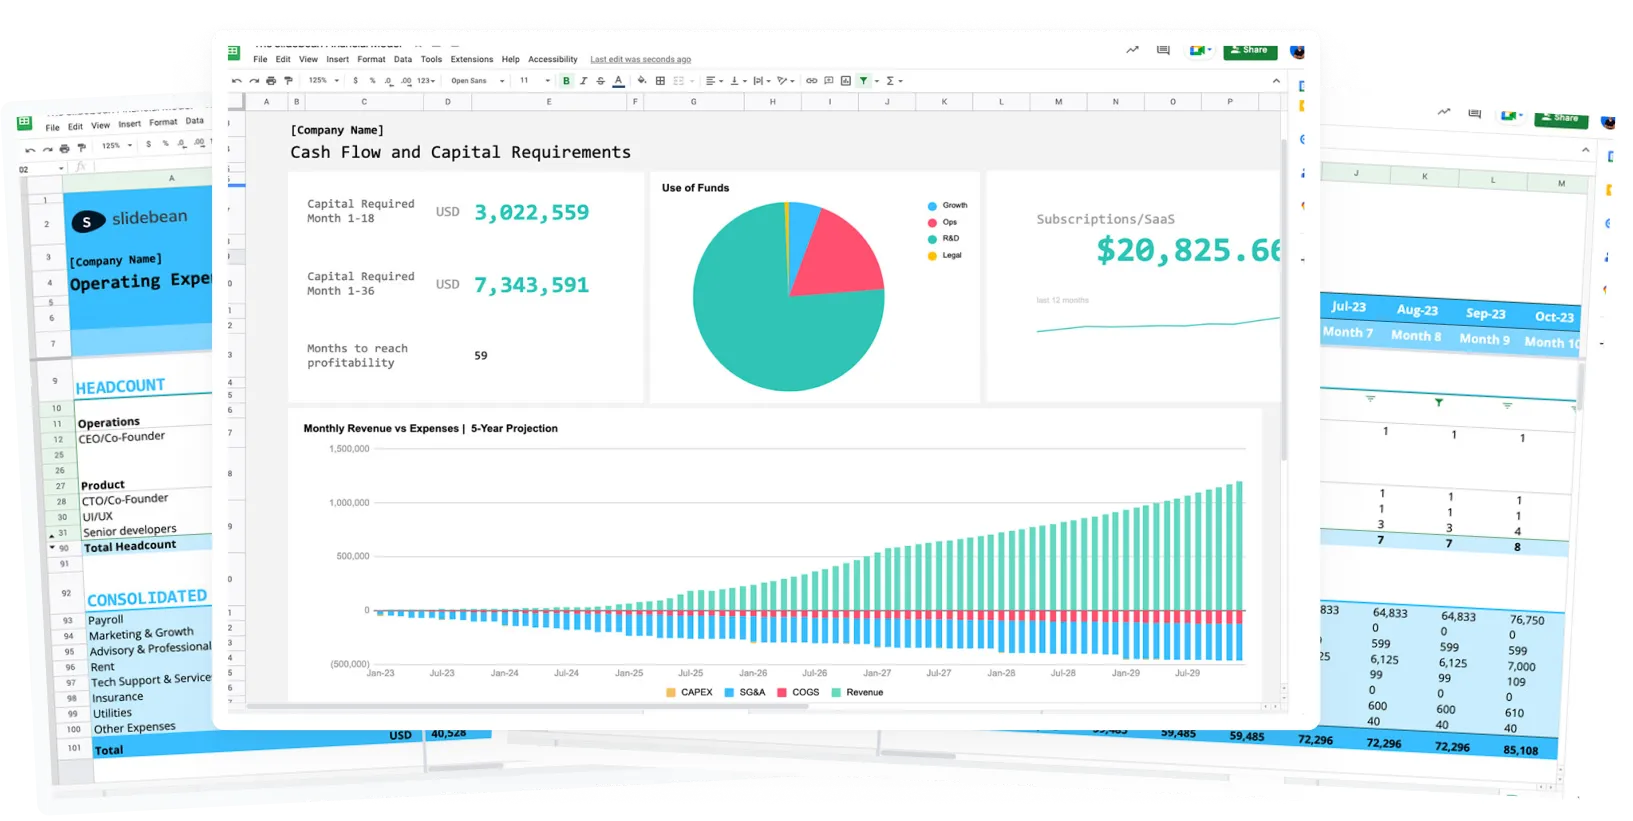
Everything here has been connected: Revenue, Costs, SG&A, and CAPEX are all connected to the summary spreadsheets: your Financial Statements, Monthly and Annual.
We also built a Cap Table here, so I if you intend to raise capital you can run assumptions on how much equity that is going to cost you.
So on this sheet you can start bringing your expenses. We also built this little tool that lets you manage your Team from a single page.
But the tough part is bringing that diagram into the model. My recommendation to keep things organized is to place all of your inputs/assumptions on the Projections page, so that you can control them from a single page.
That would eventually allow you to run scenarios, to compare what would happen with one set of variables versus the other.- but let’s not get ahead of ourselves.
The idea now is to list all these drivers- because they will be inputs or variables that will cause things to change in the model.
A common practice is to make variables blue, and results black: that way you know which numbers you are supposed to be changing, and which ones not.
Here’s how that eCommerce model ended up looking. We have Organic Traffic and Paid Marketing as drivers.
We have an average order size, shipping costs, and Margin per order. In this case, added some functionality for re-ordering: essentially saying that a set of the customers that make a purchase become regulars, and they continue to make a set of orders per month.

On the Mobile App financial model, since there are many possible ways in which you can monetize your active users- we used Monthly Active Users as a driver for many revenue lines: from Ads, to in-App Purchases to Subscriptions- but again, Monthly Active Users is itself driven by your marketing efforts.
Connecting these formulas is the ‘easy’ part. It’s tedious, and that’s the part where our team can help the most- but again the key is understanding what happens behind it.
Free Resources
- The blank model is available as a free download.
- We’ve standardized templates for the most common scenarios, they are all available to our Slidebean customers.
- Last but not least, if you need my team or myself to help you build a model, more like a turn-key service, you should chat with our sales team.
